WEATHER EXTREMES AT THE
VK2KRR SITE
As can often be the case, a good radio site can
often be faced with extreme weather conditions, especially sites on hill tops.
While here, I am not on a hill top, but on the western slope, the hill towers
300 m higher than the house. The weather here gets really bad at times.
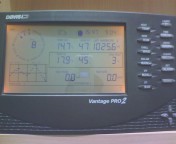
I recently acquired a DAVIS Vantage Pro2 weather
station to monitor the weather. This was mainly to help with the tropospheric
propagation study, but also to assist with warnings and wind directions when
some bad weather comes so I can take action to try prevent damage to the radio
system.
Our VK2KRR weather station data available LIVE
online here!
Severe
Weather Watchers Australia - Facebook Page
| 2019 |
WIND
MAX |
TEMP
MIN |
TEMP
MAX |
HUM
MIN |
HUM
MAX |
BARO
MIN |
BARO
MAX |
RAIN
AMT |
Visual
INV |
| JANUARY |
69
km/h N |
12.8 degC |
45.5 degC |
8 % |
89 % |
998.6 |
1013.8 |
6 mm |
0 |
| FEBRUARY |
64
km/h N |
9.1
degC |
38.8
degC |
14 % |
90 % |
1003.2 |
1020.6 |
7 mm |
0 |
| MARCH |
56
km/h W |
6.9 degC |
38.4
degC |
17 % |
93 % |
1000.6 |
1020.0 |
31
mm |
0 |
| APRIL |
55
km/h NE |
4.7
degC |
30.6
degC |
18 % |
93 % |
1000.9 |
1023.2 |
19
mm |
1 |
| MAY |
61
km/h NE |
3.7
degC |
24.4
degC |
41 % |
96 % |
1005.9 |
1028.2 |
46 mm |
0 |
| JUNE |
|
|
|
|
|
|
|
mm |
3 |
| JULY |
|
|
|
|
|
|
|
mm |
4 |
| AUGUST |
61
km/h NW |
-1.6
degC |
20.6
degC |
32 % |
97 % |
995.5 |
1030.2 |
12 mm |
4 |
| SEPTEMBER |
56
km/h SW |
-0.2
degC |
24.7
degC |
26 % |
96 % |
998.5 |
1028.2 |
7 mm |
1 |
| OCTOBER |
|
|
|
|
|
|
|
mm |
|
| NOVEMBER |
|
|
|
|
|
|
|
mm |
|
| DECEMBER |
|
|
|
|
|
|
|
mm |
|
| 2018 |
WIND
MAX |
TEMP
MIN |
TEMP
MAX |
HUM
MIN |
HUM
MAX |
BARO
MIN |
BARO
MAX |
RAIN
AMT |
Visual
INV |
| JANUARY |
61
km/h N |
10.2 degC |
43.3 degC |
8 % |
95 % |
995.9 |
1016.4 |
87 mm |
0 |
| FEBRUARY |
55
km/h |
14.1 degC |
38.9 degC |
14 % |
91 % |
997.3 |
1020.3 |
6 mm |
0 |
| MARCH |
63
km/h W |
7.8 degC |
33.8 degC |
13 % |
88 % |
1001.3 |
1023.2 |
8 mm |
0 |
| APRIL |
66
km/h NE |
7.4degC |
36.0 degC |
13 % |
92 % |
996.4 |
1023.3 |
2 mm |
0 |
| MAY |
56
km/h NW |
1.6 degC |
27.8 degC |
20 % |
97 % |
1005.2 |
1029.5 |
30 mm |
0 |
| JUNE |
50
km/h SE |
-0.5 degC |
18.3
degC |
46
% |
97 % |
1005.0 |
1030.2 |
30 mm |
6 |
| JULY |
74 km/h N |
-4.1
degC |
19.4 degC |
33 % |
97 % |
994.3 |
1029.9 |
27 mm |
3 |
| AUGUST |
74
km/h N |
-2.4
degC |
19.8
degC |
33 % |
96 % |
994.8 |
1023.9 |
20 mm |
4 |
| SEPTEMBER |
68
km/h NE |
-0.2
degC |
24.3 degC |
16 % |
97 % |
999.8 |
1026.6 |
15 mm |
3 |
| OCTOBER |
53
km/h W |
5.8 degC |
33.7 degC |
9 % |
94 % |
1004.0 |
1024.1 |
39 mm |
2 |
| NOVEMBER |
68
km/h W |
6.0 degC |
37.4 degC |
13 % |
96 % |
994.2 |
1017.9 |
81 mm |
0 |
| DECEMBER |
74
km/h SE |
10.9 degC |
42.2 degC |
7 % |
92 % |
990.8 |
1017.4 |
30 mm |
0 |
| 2017 |
WIND
MAX |
TEMP
MIN |
TEMP
MAX |
HUM
MIN |
HUM
MAX |
BARO
MIN |
BARO
MAX |
RAIN
AMT |
Visual
INV |
| JANUARY |
82 km/h
W |
11.7
degC |
41.2
degC |
7 % |
96 % |
992.2 |
1015.0 |
20.2 mm |
0 |
| FEBRUARY |
64
km/h W |
8.1
degC |
44.7
degC |
11% |
93 % |
997.1 |
1017.5 |
14.0
mm |
2 |
| MARCH |
72
km/h W |
8.9
degC |
35.4
degC |
19 % |
94 % |
997.1 |
1020.3 |
67 mm |
0 |
| APRIL |
60 km/h
N |
4.1
degC |
27.7
degC |
25 % |
97 % |
1003.0 |
1026.2 |
37 mm |
1 |
| MAY |
53
km/h NE |
1.8
degC |
22.2
degC |
33 % |
97 % |
1006.7 |
1027.1 |
24 mm |
2 |
| JUNE |
38
km/h NE |
-1.5
degC |
18.4
degC |
39 % |
97 % |
1012.0 |
1032.7 |
1.2 mm |
2 |
| JULY |
61 km/h
N |
-1.8
degC |
18.7
degC |
36 % |
97 % |
1005.3 |
1031.5 |
27.0
mm |
1 |
| AUGUST |
61
km/h N |
-1.8
degC |
19.9
degC |
28 % |
97 % |
997.3 |
1026.1 |
29.2
mm |
6 |
| SEPTEMBER |
69
km/h N |
1.4 degC |
34.3
degC |
10 % |
96 % |
991.1 |
1024.5 |
2.2 mm |
3 |
| OCTOBER |
51
km/h NE |
3.1
degC |
26.6
degC |
20 % |
94 % |
1006.4 |
1020.9 |
12.2
mm |
3 |
| NOVEMBER |
64 km/h NE |
5.3
degC |
33.5
degC |
13 % |
94 % |
1004.4 |
1023.3 |
54.6
mm |
0 |
| DECEMBER |
64
km/h |
9.9
degC |
38.3
degC |
12 % |
96 % |
995.9 |
1018.3 |
123.4
mm |
0 |
| 2016 |
WIND
MAX |
TEMP
MIN |
TEMP
MAX |
HUM
MIN |
HUM
MAX |
BARO
MIN |
BARO
MAX |
RAIN
AMT |
Visual
INV |
| JANUARY |
66
km/h S |
11.1
degC |
42.3
degC |
10 % |
92 % |
996.3 |
1023.8 |
117 mm |
0 |
| FEBRUARY |
72 km/h
W |
10.1
degC |
39.5
degC |
11 % |
89 % |
996.2 |
1020.2 |
0 mm |
0 |
| MARCH |
82 km/h
W |
8.2 degC |
37.4
degC |
11 % |
93 % |
994.1 |
1017.2 |
15 mm |
0 |
| APRIL |
50
km/h SW |
6.8
degC |
31.8
degC |
12 % |
94 % |
1008.0 |
1028.3 |
12 mm |
0 |
| MAY |
77 km/h
NW |
7.0 degC |
24.1
degC |
33 % |
94 % |
996.2 |
1022.9 |
85 mm |
0 |
| JUNE |
82 km/h
W |
1.1
degC |
17.2
degC |
44 % |
97 % |
994.8 |
1035.0 |
106 mm |
1 |
| JULY |
71 km/h
NW |
1.7
degC |
18.9
degC |
47 % |
97 % |
996.0 |
1030.5 |
85 mm |
1 |
| AUGUST |
72 km/h NE |
2.5
degC |
19.5
degC |
41 % |
97 % |
1005.8 |
1029.1 |
51 mm |
4 |
| SEPTEMBER |
63 km/h
N |
4.4
degC |
20.1
degC |
35 % |
96 % |
987.9 |
1028.4 |
151 mm |
0 |
| OCTOBER |
72
km/h SW |
4.5
degC |
25.1
degC |
36 % |
96 % |
993 .0 |
1022.3 |
27 mm |
0 |
| NOVEMBER |
62
km/h NE |
6.0
degC |
36.6
degC |
7 % |
95 % |
994.7 |
1018.5 |
30 mm |
3 |
| DECEMBER |
63
km/h W |
7.7
degC |
37.3
degC |
11 % |
95 % |
995.8 |
1018.5 |
45 mm |
0 |
| 2015 |
WIND
MAX |
TEMP
MIN |
TEMP
MAX |
HUM
MIN |
HUM
MAX |
DEWP
MIN |
BARO
MIN |
BARO
MAX |
RAIN
AMT |
Visual
INV |
| JANUARY |
88 Km/h
N |
7.5 degC |
38.4
degC |
9 % |
96 % |
-4
degC |
995.5 |
1016.3 |
73.0 mm |
0 |
| FEBRUARY |
98
km/h SE |
13.7
degC |
38.2
degC |
12 % |
89 % |
3
degC |
1003.4 |
1022.9 |
49.0
mm |
0 |
| MARCH |
64
km/h N |
4.5
degC |
35.2
degC |
11 % |
87 % |
-6
degC |
998.3 |
1021.5 |
3.0 mm |
1 |
| APRIL |
53 km/h NE |
4.8 degC |
28.0
degC |
19 % |
95 % |
-3
degC |
1000.4 |
1027.0 |
45.0
mm |
1 |
| MAY |
69 km/h
W |
0.5
degC |
25.0
degC |
19 % |
93 % |
-4 degC |
1001.7 |
1033.1 |
30.0 mm |
1 |
| JUNE |
58
km/h SW |
-2.8
degC |
18.0
degC |
40 % |
97 % |
-2
degC |
1004.0 |
1032.8 |
113.0 mm |
1 |
| JULY |
58
km/h N |
-3.1
degC |
17.2
degC |
44 % |
97 % |
-3
degC |
1000.3 |
1033.0 |
34.0
mm |
0 |
| AUGUST |
66 km/h N |
-4.3
degC |
20.0
degC |
48 % |
96 % |
-3
degC |
999.8 |
1028.0 |
50.0
mm |
0 |
| SEPTEMBER |
51
km/h NE |
-2.0
degC |
24.0
degC |
52 % |
95 % |
-1
degC |
1000.9 |
1020.6 |
22.0
mm |
6 |
| OCTOBER |
65
km/h NE |
2.0
degC |
32.0
degC |
15 % |
90 % |
- |
- |
- |
12.0
mm |
2 |
| NOVEMBER |
85
km/h W |
4.3 degC |
37.9 degC |
8 % |
100 % |
- |
993.4 |
1017.6 |
75 mm |
0 |
| DECEMBER |
69
km/h W |
7.7
degC |
40.2
degC |
9 % |
91 % |
- |
999.7 |
1023.0 |
36 mm |
0 |
| 2014 |
WIND
MAX |
TEMP
MIN |
TEMP
MAX |
HUM
MIN |
HUM
MAX |
DEWP
MIN |
BARO
MIN |
BARO
MAX |
RAIN
AMT |
Visual
INV |
| JANUARY |
64 Km/h
N |
7.3 degC |
46.5
degC |
7 % |
91 % |
-4.0
degC |
995.8 |
1018.7 |
17.0 mm |
0 |
| FEBRUARY |
80
Km/h NE |
8.3
degC |
44.0
degC |
6 % |
94 % |
-7.0
degC |
991.1 |
1018.4 |
55.0 mm |
0 |
| MARCH |
68 Km/h NE |
7.5
degC |
38.4 degC |
11 % |
92 % |
-5.0
degC |
1000.1 |
1021.9 |
52.0
mm |
0 |
| APRIL |
53
km/h S |
3.9
degC |
31.2
degC |
35 % |
94 % |
+2.0
degC |
1002.4 |
1021.6 |
50.0
mm |
0 |
| MAY |
66 km/h
NE |
2.9
degC |
25.0
degC |
35 % |
93 % |
-2.0
degC |
993.6 |
1023.8 |
36.0 mm |
0 |
| JUNE |
69 km/h
NE |
3.2
degC |
21.1
degC |
46 % |
99 % |
-2.0
degC |
996.8 |
1029.4 |
50.0
mm |
1 |
| JULY |
53 km/h
NE |
-3.5
degC |
15.9
degC |
40 % |
97 % |
-4.0
degC |
996.0 |
1030.1 |
25.0 mm |
3 |
| AUGUST |
53
km/h NW |
-5.1
degC |
15.0
degC |
36 % |
92 % |
-4.0
degC |
1003.9 |
1031.4 |
3.0 mm |
3 |
| SEPTEMBER |
69
km/h NE |
-1.8
degC |
28.1
degC |
25 % |
93 % |
-3.0
degC |
998.6 |
1029.0 |
19.0
mm |
1 |
| OCTOBER |
63
km/h NW |
2.9
degC |
35.2
degC |
10 % |
93 % |
-3.0
degC |
1001.4 |
1024.9 |
8.0 mm |
0 |
| NOVEMBER |
76 km/h N |
2.9
degC |
41.1
degC |
8 % |
96 % |
-6.0
degC |
995.8 |
1020.8 |
43.0 mm |
3 |
| DECEMBER |
82 km/h
S |
8.0
degC |
36.2
degC |
5 % |
88 % |
-11.0
degC |
993.1 |
1015.7 |
14.0 mm |
0 |
| 2013 |
WIND
MAX |
TEMP
MIN |
TEMP
MAX |
HUM
MIN |
HUM
MAX |
DEWP
MIN |
BARO
MIN |
BARO
MAX |
RAIN
AMT |
Visual
INV |
| JANUARY |
79 Km/h
NW |
7.1 degC |
49.2
degC |
7 % |
92 % |
-7.0
degC |
991.8 |
1015.2 |
5.5 mm |
0 |
| FEBRUARY |
64
Km/h W |
9.8
degC |
39.0
degC |
11 % |
78 % |
-3.0
degC |
1002.4 |
1019.3 |
62.0 mm |
0 |
| MARCH |
63
km/h S |
5.5
degC |
35.6
degC |
20 % |
93 % |
-4.0
degC |
1003.7 |
1020.5 |
49.0 mm |
0 |
| APRIL |
53
km/h S |
3.7
degC |
32.2
degC |
18 % |
90 % |
-3.0
degC |
1004.9 |
1026.7 |
12.0 mm |
0 |
| MAY |
53 km/h
NE |
-0.2 degC |
26.2
degC |
27 % |
96 % |
-3.0
degC |
1006.8 |
1028.1 |
63.0 mm |
2 |
| JUNE |
56
km/h NE |
-0.6
degC |
21.9
degC |
35 % |
97 % |
-2.0 degC |
1002.8 |
1028.3 |
81.0
mm |
1 |
| JULY |
72
km/h W |
-2.5
degC |
20.5
degC |
45 % |
96 % |
-1.0
degC |
1002.5 |
1033.2 |
46.0
mm |
0 |
| AUGUST |
64
km/h W |
-1.5
degC |
23.2
degC |
34 % |
96 % |
-1.0
degC |
1002.3 |
1024.0 |
33.0
mm |
0 |
| SEPTEMBER |
84 km/h
NE |
0.8
degC |
29.0
degC |
21 % |
94 % |
-3.0
degC |
995.6 |
1029.3 |
45.0 mm |
2 |
| OCTOBER |
76
km/h N |
-1.0 degC |
34.0
degC |
11 % |
91 % |
-9.0
degC |
996.5 |
1024.2 |
6.0 mm |
2 |
| NOVEMBER |
68
km/h SW |
5.3
degC |
35.1
degC |
11 % |
82 % |
-7.0
degC |
999.8 |
1024.4 |
0.0 mm |
2 |
| DECEMBER |
61
km/h SW |
3.1
degC |
43.1
degC |
6 % |
94 % |
-13.0
degC |
995.3 |
1019.7 |
34.0
mm |
0 |
| 2012 |
WIND
MAX |
TEMP
MIN |
TEMP
MAX |
HUM
MIN |
HUM
MAX |
DEWP
MIN |
BARO
MIN |
BARO
MAX |
RAIN
AMT |
Visual
INV |
| JANUARY |
74 Km/h
W |
6.5
degC |
42.0
degC |
11 % |
95 % |
-5.0
degC |
991.4 |
1018.1 |
56.0 mm |
0 |
| FEBRUARY |
63 Km/h W |
10.3
degC |
34.0
degC |
13 % |
93 % |
1.0
degC |
992.0 |
1019.4 |
109 mm |
0 |
| MARCH |
64
Km/h SE |
4.2
degC |
32.9
degC |
30 % |
97 % |
3.0 degC |
998.2 |
1021.2 |
190 mm |
1 |
| APRIL |
55
Km/h SW |
2.0
degC |
31.0
degC |
24 % |
93 % |
-2.0
degC |
1005.5 |
1031.5 |
45.0 mm |
2 |
| MAY |
61 Km/h
NE |
-0.3
degC |
25.0
degC |
26% |
95 % |
-1.0
degC |
1007.1 |
1032.5 |
44.0 mm |
2 |
| JUNE |
69 Km/h
N |
-3.3
degC |
18.3
degC |
42 % |
94 % |
-3.0
degC |
996.2 |
1029.2 |
17.0 mm |
4 |
| JULY |
61 Km/h NW |
-3.5
degC |
17.0
degC |
41 % |
96 % |
-4.0
degC |
1004.7 |
1032.9 |
54.0 mm |
6 |
| AUGUST |
76 Km/h
SW |
-2.9
degC |
22.0
degC |
31 % |
97 % |
-2.0
degC |
999.0 |
1025.0 |
46.0 mm |
0 |
| SEPTEMBER |
88 Km/h
N |
-1.9
degC |
29.0
degC |
22 % |
94 % |
-2.0
degC |
997.4 |
1022.9 |
4.0 mm |
1 |
| OCTOBER |
64 Km/h
N |
1.7
degC |
34.5
degC |
11 % |
93 % |
-4.0
degC |
1002.3 |
1029.8 |
14.0 mm |
1 |
| NOVEMBER |
60
km/h SW |
6.3
degC |
33.9
degC |
13 % |
96 % |
-5.0
degC |
1001.8 |
1023.7 |
22.0
mm |
0 |
| DECEMBER |
77 km/h
NW |
5.5
degC |
39.5
degC |
9 % |
91 % |
-5.0
degC |
997.8 |
1022.0 |
19.0 mm |
0 |
| 2011 |
WIND
MAX |
TEMP
MIN |
TEMP
MAX |
HUM
MIN |
HUM
MAX |
DEWP
MIN |
BARO
MIN |
BARO
MAX |
RAIN
AMT |
Visual
INV |
| JANUARY |
64
Km/h NW |
9.4
degC |
41.0
degC |
11 % |
93 % |
-4.0
degC |
998.6 |
1015.7 |
70.0 mm |
0 |
| FEBRUARY |
80
Km/h NW |
9.1 degC |
42.3
degC |
13 % |
95 % |
6.0
degC |
1001.9 |
1015.7 |
162
mm |
0 |
| MARCH |
58
Km/h NW |
5.0
degC |
30.3
degC |
24 % |
96 % |
2.0
degC |
997.7 |
1024.0 |
51.0 mm |
0 |
| APRIL |
58 Km/h
N |
3.1
degC |
28.0
degC |
27 % |
96 % |
2.0
degC |
1006.6 |
1028.6 |
33.0 mm |
0 |
| MAY |
64 Km/h
N |
-1.6
degC |
23.0
degC |
27 % |
96 % |
-1.0
degC |
999.0 |
1030.0 |
40.0 mm |
2 |
| JUNE |
69 km/h
N |
-1.3
degC |
19.3
degC |
41 % |
96 % |
-1.0
degC |
998.2 |
1026.6 |
31.0 mm |
2 |
| JULY |
60 km/h
W |
-2.1
degC |
20.0
degC |
35 % |
98 % |
-3.0
degC |
1005.8 |
1033.5 |
36.0 mm |
1 |
| AUGUST |
63 km/h NE |
-0.8 degC |
23.9
degC |
27 % |
96 % |
-1.0
degC |
1003.3 |
1036.3 |
34.0 mm |
1 |
| SEPTEMBER |
74
km/h NE |
-0.7 degC |
29.1
degC |
12 % |
93 % |
-7.0
degC |
991.8 |
1025.1 |
25.0 mm |
1 |
| OCTOBER |
68 km/h
N |
3.2
degC |
36.0
degC |
18 % |
95 % |
-4.0
degC |
999.4 |
1030.1 |
18.0 mm |
0 |
| NOVEMBER |
98 km/h
NW |
5.7 degC |
38.8 degC |
17 % |
93 % |
-3.0 degC |
1001.7 |
1020.8 |
98.0 mm |
0 |
| DECEMBER |
64 km/h
S |
7.6
degC |
33.1
degC |
13 % |
91 % |
-7.0
degC |
998.1 |
1019.3 |
74.0
mm |
0 |
| 2010 |
WIND
MAX |
TEMP
MIN |
TEMP
MAX |
HUM
MIN |
HUM
MAX |
DEWP
MIN |
BARO
MIN |
BARO
MAX |
RAIN
AMT |
Visual
INV |
| JANUARY |
64 Km/h W |
9.0 degC |
47.5 degC |
5 % |
81 % |
-12.0 degC |
999.9 |
1015.4 |
1.2 mm |
0 |
| FEBRUARY |
68 Km/h N |
18.1 degC |
37.9 degC |
12 % |
93 % |
-1.0 degC |
1001.7 |
1022.5 |
63.0 mm |
0 |
| MARCH |
58 Km/h NW |
7.0 degC |
32.6 degC |
11 % |
93 % |
-7.0 degC |
1003.5 |
1034.1 |
90.0 mm |
0 |
| APRIL |
NA |
NA |
NA |
NA |
NA |
NA |
NA |
NA |
42.0 mm |
0 |
| MAY |
NA |
NA |
NA |
NA |
NA |
NA |
NA |
NA |
73.0 mm |
1 |
| JUNE |
74 Km/h
NW |
-1.2 degC |
18.1 degC |
44 % |
96 % |
-2.0 degC |
1007.4 |
1034.1 |
21.0 mm |
1 |
| JULY |
77 Km/h
NE |
-2.6
degC |
15.8
degC |
46 % |
98 % |
-2.0
degC |
1000.0 |
1033.5 |
51.0 mm |
1 |
| AUGUST |
64
Km/h NE |
0.0
degC |
15.5
degC |
37
% |
97 % |
-2.0
degC |
994.9 |
1026.8 |
80.0
mm |
0 |
| SEPTEMBER |
84
Km/h N |
-0.3
degC |
22.0 degC |
44 % |
95 % |
+1.0
degC |
997.2 |
1025.0 |
70.0
mm |
0 |
| OCTOBER |
71
Km/h N |
3.0
degC |
27.1
degC |
26
% |
98
% |
-1.0
degC |
981.3 |
1028.6 |
187
mm |
0 |
| NOVEMBER |
82
Km/h NW |
6.3
degC |
32.1
degC |
15
% |
96 % |
-1.0
degC |
1002.4 |
1023.1 |
84.0
mm |
0 |
| DECEMBER |
82
Km/h NW |
5.1
degC |
35.9
degC |
14
% |
92 % |
-3.0
degC |
991.8 |
1012.9 |
49.0
mm |
2 |
| 2009 |
WIND
MAX |
TEMP
MIN |
TEMP
MAX |
HUM
MIN |
HUM
MAX |
DEWP
MIN |
BARO
MIN |
BARO
MAX |
RAIN
AMT |
Visual
INV |
| JANUARY |
69 Km/h NW |
8.0 degC |
49.9 degC |
5 % |
79 % |
-10.0 degC |
996.6 |
1017.6 |
6.0 mm |
0 |
| FEBRUARY |
66 Km/h N |
8.0 degC |
45.0 degC |
8 % |
79 % |
-4.0 degC |
999.6 |
1020.8 |
0.0 mm |
0 |
| MARCH |
68 Km/h N |
6.8 degC |
35.9 degC |
14 % |
87 % |
-3.0 degC |
1003.5 |
1019.3 |
6.0 mm |
0 |
| APRIL |
68 Km/h N |
1.8 degC |
32.5 degC |
19 % |
93 % |
-5.0 degC |
996.7 |
1023.9 |
34.0 mm |
2 |
| MAY |
72 Km/h N |
1.8 degC |
24.3 degC |
33 % |
97 % |
1.0 degC |
1020.4 |
1030.4 |
15.0 mm |
0 |
| JUNE |
74 Km/h N |
-1.7 degC |
19.5 degC |
36 % |
94 % |
-2.0 degC |
1003.5 |
1028.3 |
65.0 mm |
1 |
| JULY |
50 Km/h W |
-1.5 degC |
17.0 degC |
45 % |
96 % |
-2.0 degC |
1003.1 |
1023.8 |
40.0 mm |
0 |
| AUGUST |
82 Km/h NW |
-3.0 degC |
22.3 degC |
33 % |
96 % |
-5.0 degC |
996.0 |
1027.3 |
40.0 mm |
0 |
| SEPTEMBER |
76 Km/h NE |
-2.0 degC |
30.6 degC |
9 % |
94 % |
-9.0 degC |
987.9 |
1021.8 |
10.0 mm |
2 |
| OCTOBER |
74 Km/h SW |
2.7 degC |
37.8 degC |
7 % |
96 % |
-9.0 degC |
995.6 |
1026.6 |
15.0 mm |
1 |
| NOVEMBER |
56 Km/h W |
8.0 degC |
39.3 degC |
10 % |
80 % |
-6.0 degC |
999.5 |
1025.7 |
20.0 mm |
0 |
| DECEMBER |
74 Km/h SW |
8.0 degC |
41.2 degC |
5% |
92 % |
-16.0 degC |
1001.5 |
1019.7 |
29.0 mm |
0 |
| 2008 |
WIND
MAX |
TEMP
MIN |
TEMP
MAX |
HUM
MIN |
HUM
MAX |
DEWP
MIN |
BARO
MIN |
BARO
MAX |
RAIN
AMT |
Visual
INV |
| JAN/FEB |
71
Km/h N |
8.4
degC |
45.5
degC |
9 % |
95 % |
-9.0
degC |
996.7 |
1021.2 |
81.4
mm |
NA |
| MARCH |
64
Km/h SE |
8.1
degC |
44.1
degC |
7 % |
71 % |
-9.0
degC |
1005.7 |
1023.7 |
9.0 mm |
NA |
| APRIL |
68
Km/h NW |
4.9
degC |
30.0
degC |
17 % |
88 % |
-2.0
degC |
1003.8 |
1024.0 |
2.0 mm |
NA |
| MAY |
NA |
NA |
NA |
NA |
NA |
NA |
NA |
NA |
NA |
NA |
| JUNE |
53
Km/h NE |
4.2
degC |
19.6
degC |
34 % |
94 % |
+2.0
degC |
1018.5 |
1028.7 |
10.0
mm |
NA |
| JULY |
58
Km/h NW |
0.0
degC |
17.5
degC |
39 % |
95 % |
-1.0
degC |
1003.3 |
1027.8 |
47.2
mm |
NA |
| AUGUST |
64
Km/h W |
-1.0
degC |
16.9
degC |
23 % |
94 % |
-5.0
degC |
1000.7 |
1028.6 |
10.4
mm |
NA |
| SEPTEMBER |
76 Km/h
NW |
-1.2
degC |
29.2
degC |
14 % |
93 % |
-5.0
degC |
999.0 |
1030.4 |
20.4 mm |
NA |
| OCTOBER |
69
Km/h W |
0.0 degC |
36.4
degC |
11 % |
92 % |
-10
degC |
1006.1 |
1025.9 |
7.0 mm |
1 |
| NOVEMBER |
69
Km/h SW |
5.0
degC |
33.2
degC |
12 % |
93 % |
- 8.0
degC |
991.7 |
1021.1 |
30.0
mm |
0 |
| DECEMBER |
68 Km/h
N |
8.0
degC |
42.1
degC |
9 % |
94 % |
- 7.0
degC |
990.7 |
1015.3 |
50.0 mm |
0 |
| 2006 |
WIND
MAX |
TEMP
MIN |
TEMP
MAX |
HUM
MIN |
HUM
MAX |
DEWP
MIN |
BARO
MIN |
BARO
MAX |
RAIN
AMT |
INV
TEMP |
| JANUARY |
71 Km/h W |
10.9 degC |
46.7 degC |
9 % |
92 % |
-7.0 DegC |
1003.0 |
1016.9 |
0.4 mm |
+2.8 degC |
| FEBRUARY |
60 Km/h SW |
6.7 degC |
45.3 degC |
8 % |
78 % |
-5.0 DegC |
998.1 |
1020.5 |
0.2 mm |
+1.5 degC |
| MARCH |
64 Km/h NE |
7.2 degC |
40.2 degC |
10 % |
86 % |
-3.0 DegC |
1004.9 |
1025.6 |
0.0 mm |
+5.3 degC |
| APRIL |
63 Km/h N |
-0.2 degC |
29.9 degC |
14 % |
93 % |
-6.0 DegC |
1002.1 |
1023.7 |
27.0 mm |
+2.0 degC |
| MAY |
68 Km/h N |
-2.0 degC |
25.3 degC |
28 % |
96 % |
-4.0 DegC |
1004.0 |
1028.7 |
2.4 mm |
+2.5 degC |
| JUNE |
53 Km/h S |
-1.5 degC |
22.0 degC |
27 % |
90 % |
-5.0 DegC |
1008.1 |
1031.0 |
21.4 mm |
+3.1 degC |
| JULY |
71 Km/h NE |
-1.0 degC |
19.0 degC |
31 % |
96 % |
-3.0 DegC |
1006.9 |
1034.0 |
36.6 mm |
+2.9 degC |
| AUGUST |
51 Km/h NE |
0.1 degC |
22.0 degC |
38 % |
92 % |
-1.0 DegC |
1014.4 |
1029.7 |
10.8 mm |
+3.0 degC |
| SEPTEMBER |
74 Km/h N |
2.3 degC |
28.7 degC |
14% |
90 % |
-8.0 DegC |
998.4 |
1035.3 |
20.6 mm |
+2.5 degC |
| OCTOBER |
72 Km/h N |
1.5 degC |
40.3 degC |
9% |
81% |
-14 degC |
1006.6 |
1031.2 |
1.0 mm |
+4.0 degC |
| NOVEMBER |
74 Km/h N |
3.2 degC |
40.5 degC |
9% |
80 % |
- 12 degC |
1005.0 |
1032.0 |
20.0 mm |
+4.2 degC |
| DECEMBER |
53 Km/h N |
8.0 degC |
41.4 degC |
6 % |
62 % |
-13 degC |
1008.6 |
1020.1 |
0.0 mm |
+2.0 degC |
| 2005 |
WIND
MAX |
TEMP
MIN |
TEMP
MAX |
HUM
MIN |
HUM
MAX |
DEWP
MIN |
BARO
MIN |
BARO
MAX |
RAIN
AMT |
INV
TEMP |
| MARCH |
61 Km/h SW |
7.8 degC |
35.6 DegC |
16 % |
100 % |
-2.0 DegC |
1011.6 |
1033.0 |
3.6 mm |
na |
| APRIL |
69 Km/h SW |
2.1 DegC |
32.2 DegC |
17 % |
100 % |
-2.0 DegC |
1010.7 |
1032.2 |
15.2 mm |
+3.2 degC |
| MAY |
50 Km/h SW |
-0.7 degC |
28.3DegC |
25 % |
93 % |
-2.0 degC |
1012.8 |
1029.9 |
4.0 mm |
+6.2 degC |
| JUNE |
63 Km/h W |
-1.0 degC |
25.5 degC |
27 % |
97 % |
-2.0 degC |
996.4 |
1030.2 |
64.8 mm |
+3.5 degC |
| JULY |
53 Km/h NE |
-0.8 degC |
17.4 degC |
41 % |
99 % |
-1.0 degC |
1007.0 |
1038.5 |
32.4 mm |
+3.6 degC |
| AUGUST |
77 km/h NE |
-0.5 degC |
22.6 degC |
38 % |
99 % |
-2.0 degC |
1003.8 |
1033.0 |
41.0 mm |
+2.0 degC |
| SEPTEMBER |
68 km/h N |
1.0 degC |
25.9 degC |
38 % |
96 % |
-2.0 degC |
998.3 |
1025.7 |
71.8 mm |
+2.5 degC |
| OCTOBER |
69 km/h NE |
1.9 degC |
32.0 degC |
28 % |
95 % |
0.0 degC |
995.7 |
1023.4 |
55.8 mm |
+4.0 degC |
| NOVEMBER |
63 km/h SW |
4.3 degC |
35.0 degC |
17 % |
91 % |
0.0 degC |
1002.7 |
1023.5 |
7.6 mm |
+1.6 degC |
| DECEMBER |
80 km/h W |
6.1 degC |
42.7 degC |
9 % |
92 % |
-7.0 degC |
997.9 |
1015.9 |
38.5 mm |
+ 2.6 degC |
* VISUAL INV is noted occurrences of visual
inversions. These are inversions bending light waves. They are Fata Morgana or
Superior Mirages which are extremely rare occurrences globally.
BACK
~INFORMATION ON
THIS SITE MAY ONLY BE REPRODUCED WITH PERMISSION,
LEIGH RAINBIRD VK2KRR~
Copyright ©Leigh Rainbird